
More than 30 interviews, design critiques, and research used to prioritise metrics and understand supervisors’ mental models.
Product design case study · Contact centre operations
Supervisors
& data
Helping contact centre supervisors understand how their operation is running, identify emerging issues, and act before they escalate.
At a glancePlatform scale
& project impact
& project impact
180countries with deployments
+10mdevelopers on the platform
25%supervisor efficiency improvement reported
+500large enterprise organisations
+300kactive customer experience professionals across the platform
20–60sless handling time reported in cross-channel deployments
40%responding faster when demand suddenly rises
**%historical reporting reduction in this initiative
01
Situation
Supervisors had data, but not enough context to act quickly.
Contact centre supervisors make daily decisions about staffing, queues, service levels, and customer experience. The information they needed was scattered across tools and screens.
Customers generated a high volume of historical reports—more than 1,500 per month in the observed context, with some customers exporting thousands. Producing these reports created recurring costs, and supervisors still had to prepare and analyse them manually before identifying operational outliers.
During a team restructure, I chose to work within the supervisor environment and focus on Supervisors & data, because this important user group had not yet received dedicated product support.
Supervisors are responsible for keeping the operation running: balancing staffing and queues, protecting contractual service commitments, and helping prevent avoidable financial loss or poor customer experiences.
Design challenge
How might we help supervisors understand how their operation is running across teams, queues, and channels, identify emerging issues, and act before they escalate?
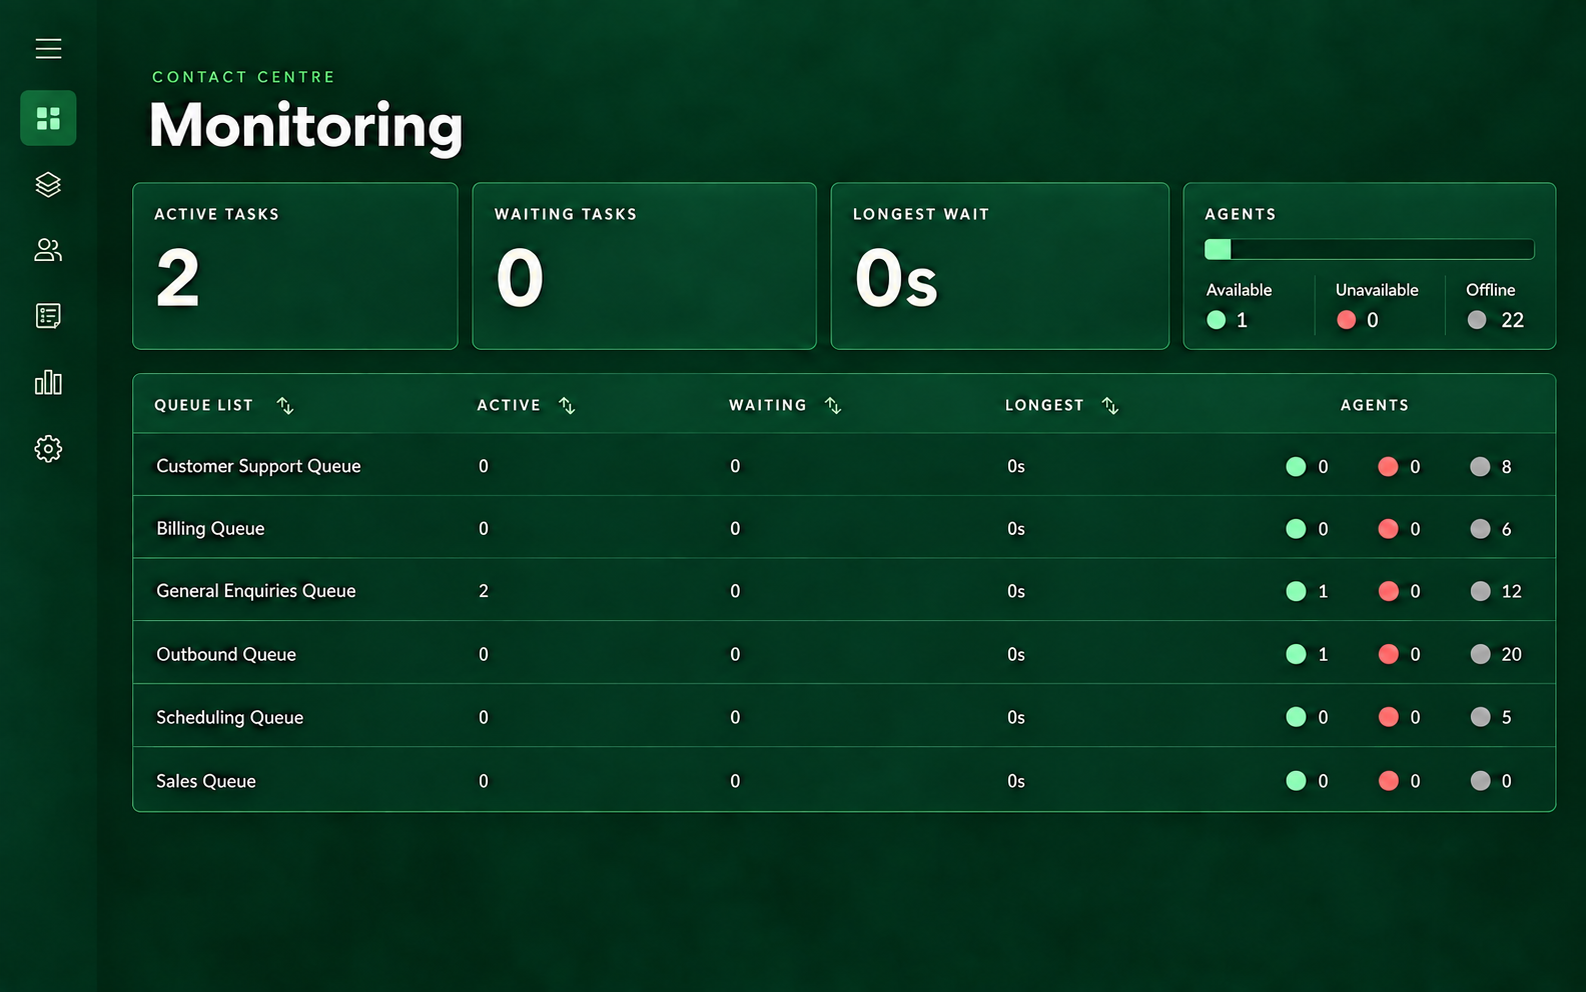
Active tasks2
Waiting tasks0
◉⌁+▥02
Problem statement
How might we turn fragmented operational data into timely, confident action?
Supervisors needed a way to see what was changing across queues and channels, understand whether a signal was healthy or at risk, and decide what to do without exporting reports or switching between tools.
- Fragmented information: metrics and queue context were spread across screens and historical reports.
- Lack of operational visibility: supervisors could not consistently see whether a queue was healthy, approaching a threshold, or experiencing a new versus persistent issue.
- Manual effort: supervisors had to prepare data, identify outliers, and decide on action before they could respond.
- Usability and accessibility gaps: the existing experience did not meet the intended AAA standard, and long names made dense operational data harder to scan.
- Extensibility and interaction gaps: the screen was not designed to accommodate new metrics, while expected controls such as ordering and Select all were limited by technical constraints.
Problem to solve
Design a monitoring experience that makes the right signal visible, gives it enough context to interpret, and supports action at the scale of a busy contact centre.
03
Role & team
End-to-end ownership across the supervisor experience.
I worked end-to-end from research through monitoring, reporting, thresholds, alerts, and notifications. The wider supervisor area also included an administrative experience with a separate ownership model. I collaborated closely with that work during the early phases; as the initiative expanded and the organisation changed, I took ownership of both experiences.
This walkthrough focuses on the supervisor monitoring experience. The administrative experience is outside the scope of this case study, but it can be shown in an approved supporting image.
Product designer (me)Product manager
Engineering managerDeveloper / UI engineer
ArchitectContent designerContent writer
04
Research & approach
From making data available to helping supervisors act on it.
Weekly checkpoints with customers who had adopted the feature helped test assumptions and shape the next phase.
AI supported interview capture, tagging, pattern identification, and consolidation. Interpretation remained human-led.
Notifications→Data with context and colour-coded status→Action
05
Foundations
Making the design system work for data.
The existing design system was not built with data visualisation in mind. I worked with the design system team to introduce patterns for status, metrics, thresholds, tooltips and data-heavy interactions.
Reusable patterns → clearer monitoring experiences
06
UI structure
A reusable structure for reading the operation.
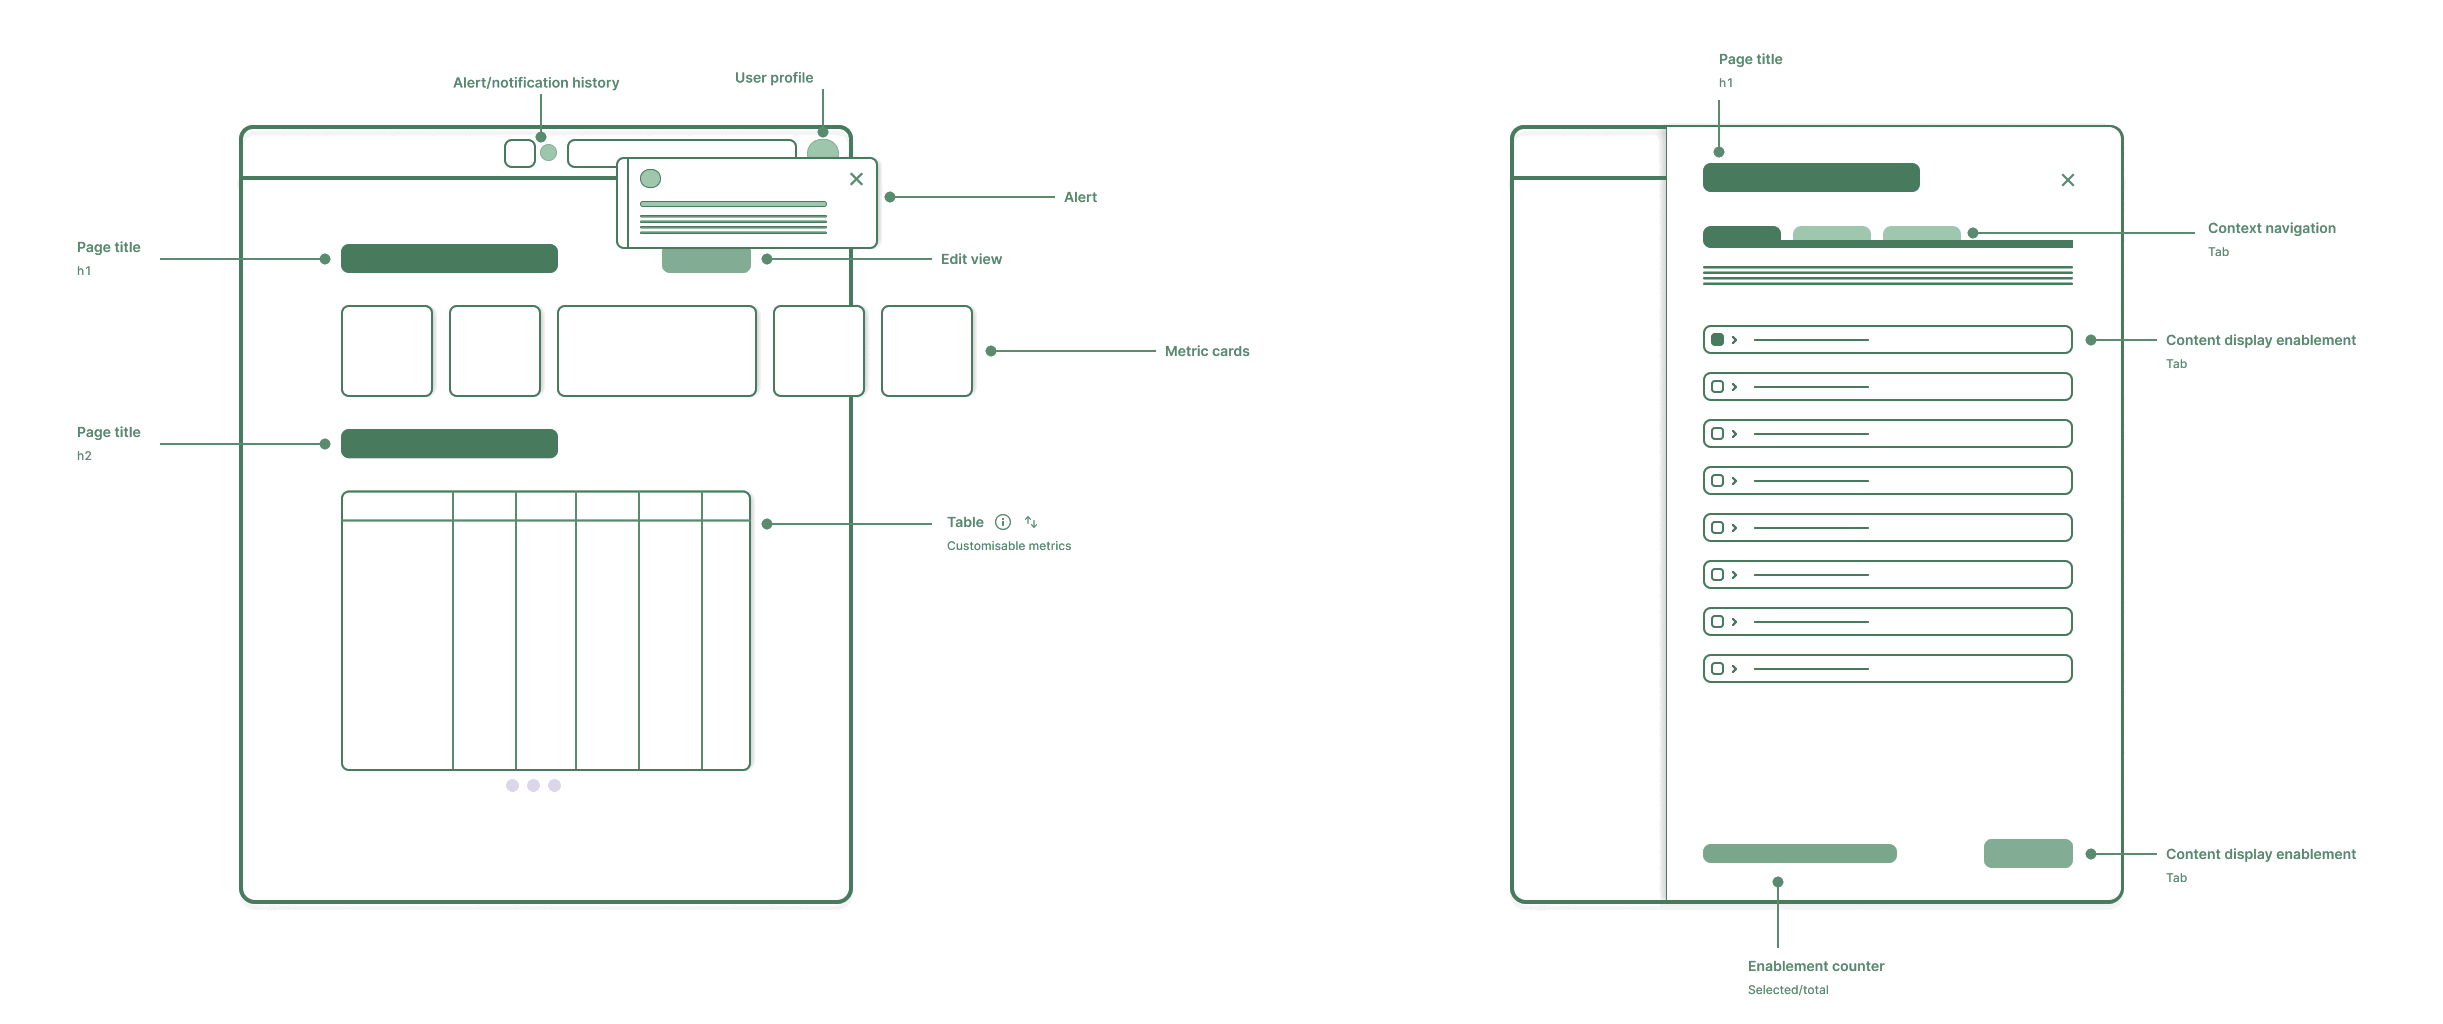
The experience was designed as a system: page-level context, configurable data tiles, and a table for detail. Select a layer to see how the structure worked.
Page structure
Orient first, then let supervisors focus.
The page established context with a title, tabs and monitoring controls, then surfaced the most important summary metrics before the detailed table. Alerts, profile controls and Edit view remained available without competing with the operational content.
Context & navigationPage title, tabs, alerts, profile and Edit view keep the monitoring context available.
Summary cardsConfigurable data tiles surface the metrics supervisors need most.
Detailed tableQueue-level metrics provide the detail needed to investigate and act.
Card anatomy
Each tile had a clear job.
A card could contain up to three metrics. The structure kept the hierarchy consistent while allowing the content to change by channel, cross-channel view and metric type.
Active tasksSupport · number counter · On track
Waiting tasksVoice · time counter · Warning
Service levelAll channels · percentage · Critical
Voice
Total waiting tasks75On track
Average waiting time17m 34s
Longest waiting time21m 12s+1m 56s
1
Card titleVoice / channel context
2
Metric titleWhat is being measured
3
Metric valueNumber, duration or percentage
4
Health badgeWarning or critical only
Scalability
Build the structure as demand grows.
The same data-tile pattern could grow from one channel to a wider operational view. Each new tile loaded with the same hierarchy: channel, metric, value and health state.
01 / one tile02 / two tiles03 / three tiles
07
Product evolution
From a static dashboard to a system that helped supervisors act.
Roadmap note. The roadmap evolved through research, customer validation, KPIs, available metrics, market context, and learning from each release. Each phase took approximately one to two quarters. QA was involved throughout; Phase 4 took longer because it required more cross-stakeholder negotiation, buy-in, and development effort.
Make prioritised metrics available. Add show, hide, and reorder preferences.
Introduce metric groups, aggregation, configurable cards, and structured tables.
Define acceptable values, warnings, critical states, and filters.
Add cross-queue summaries, alerts, and updates across the issue lifecycle.
01
Enablement
Selected metrics became available, with controls to show, hide, and reorder information. I supervised the designer working on this phase.
02
Organization & context
I took design leadership from this phase onward. Channel-specific and cross-channel metric groups, top-level aggregation, configurable cards, and structured tables made the experience scalable.
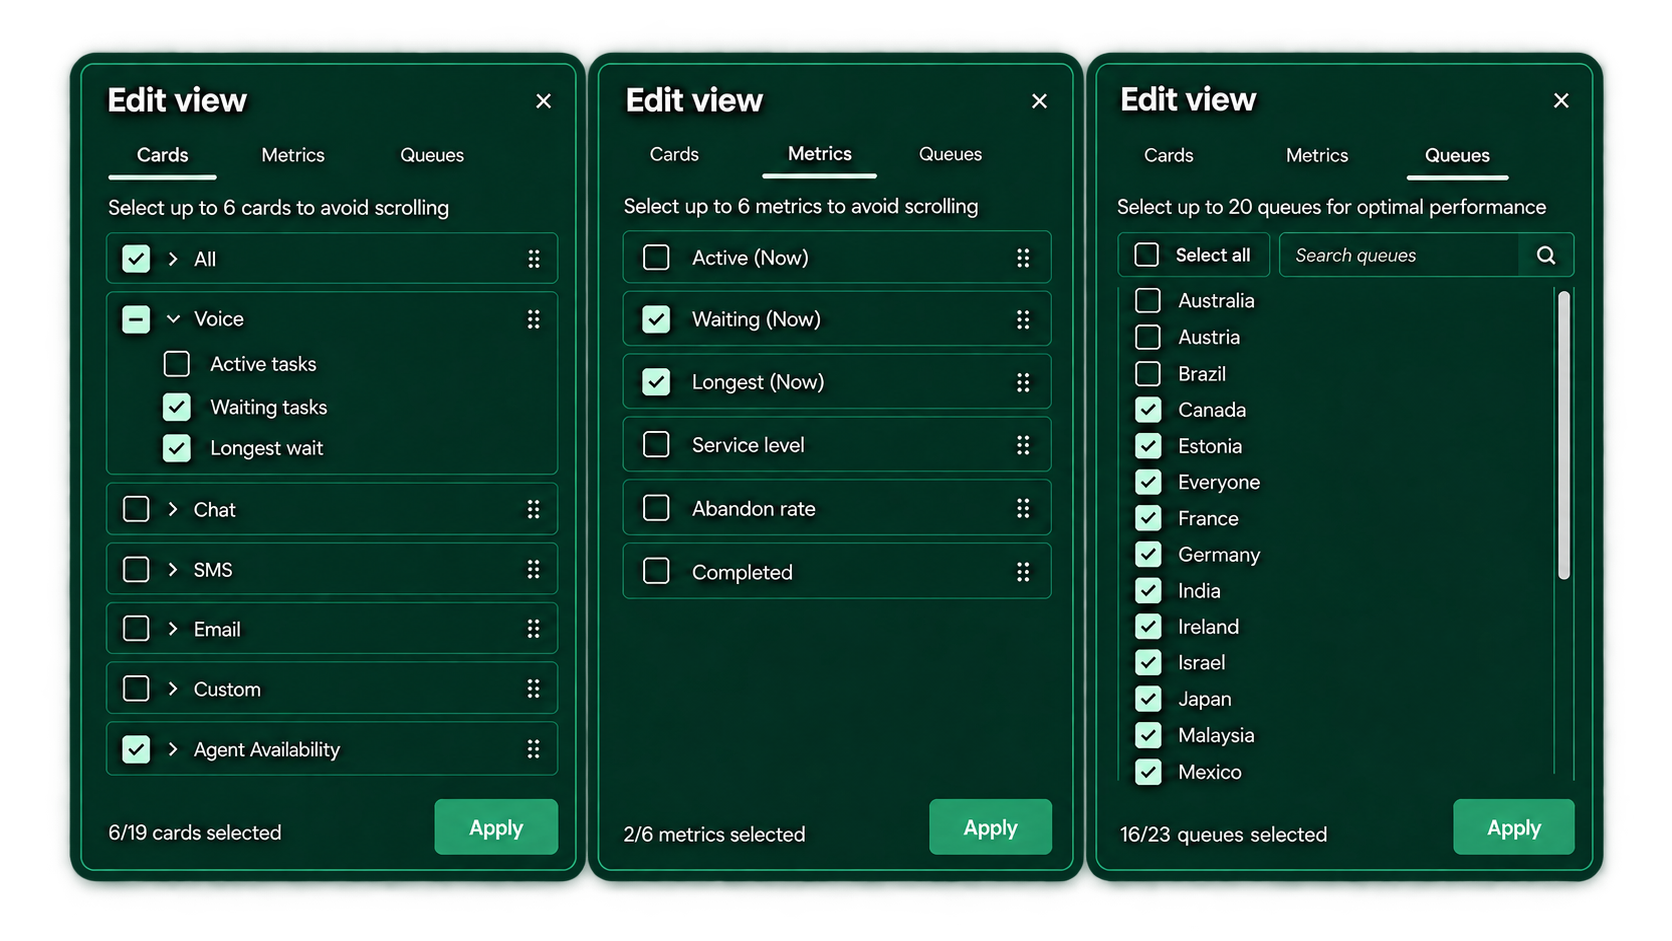
03
Thresholds & queue health
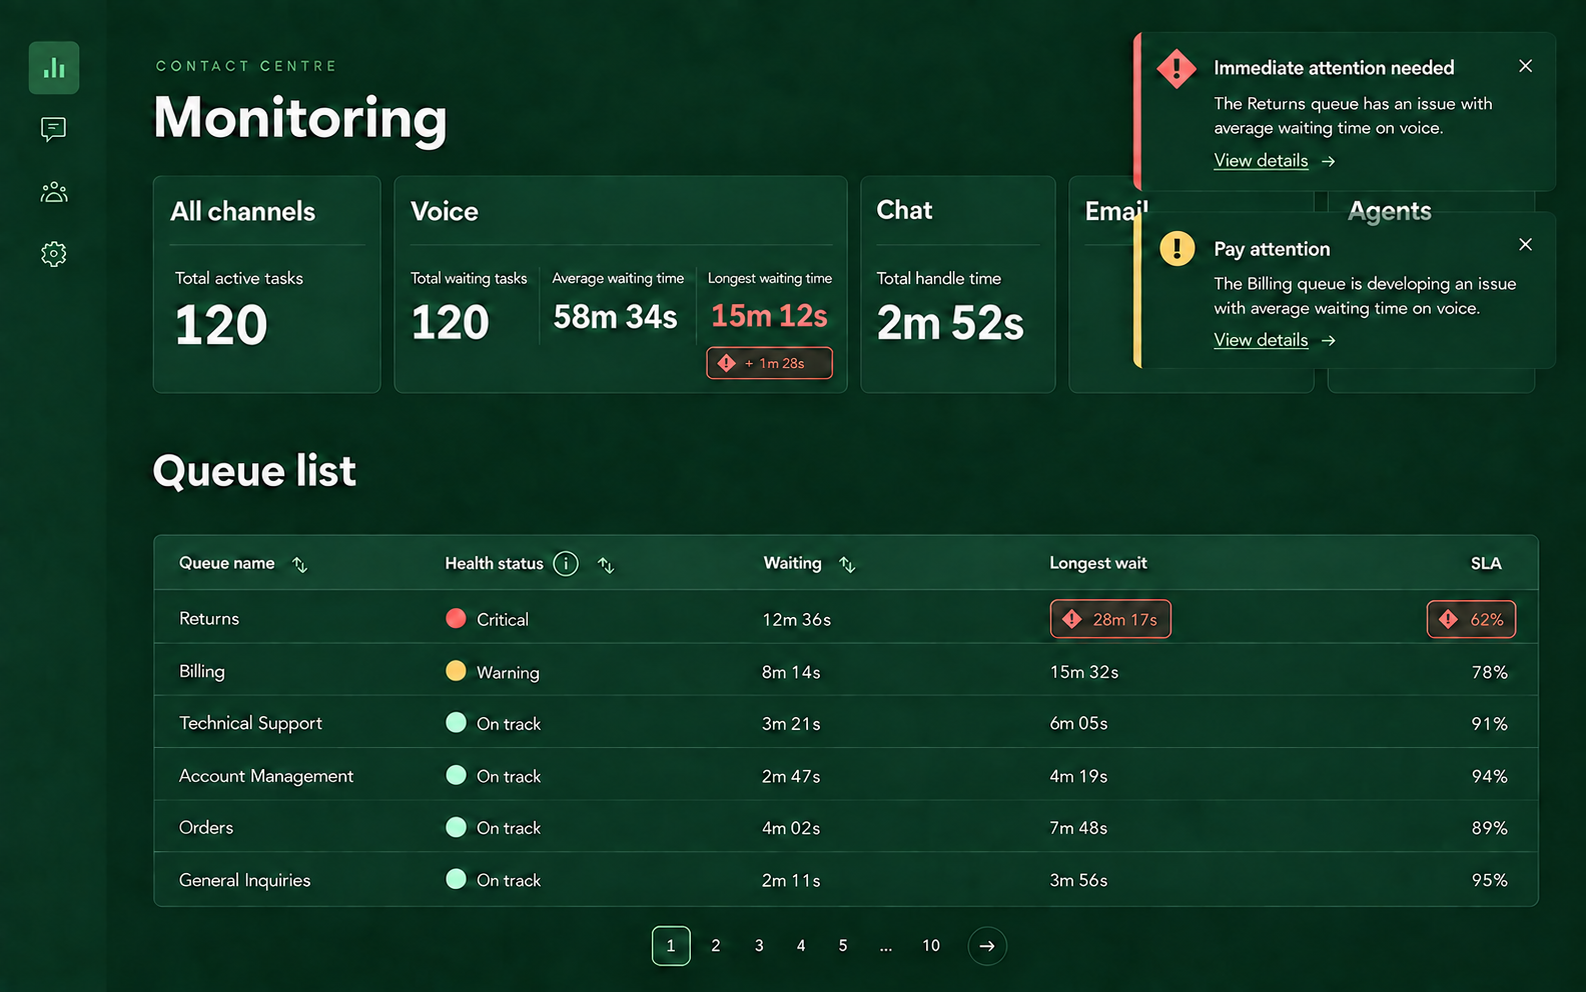
To address the lack of operational visibility, I introduced a health column and threshold-based queue states. Metrics communicated On track, Warning, or Critical, helping supervisors distinguish a healthy queue from an emerging or persistent issue. Filters helped supervisors focus on the relevant teams, queues, channels, or metrics.
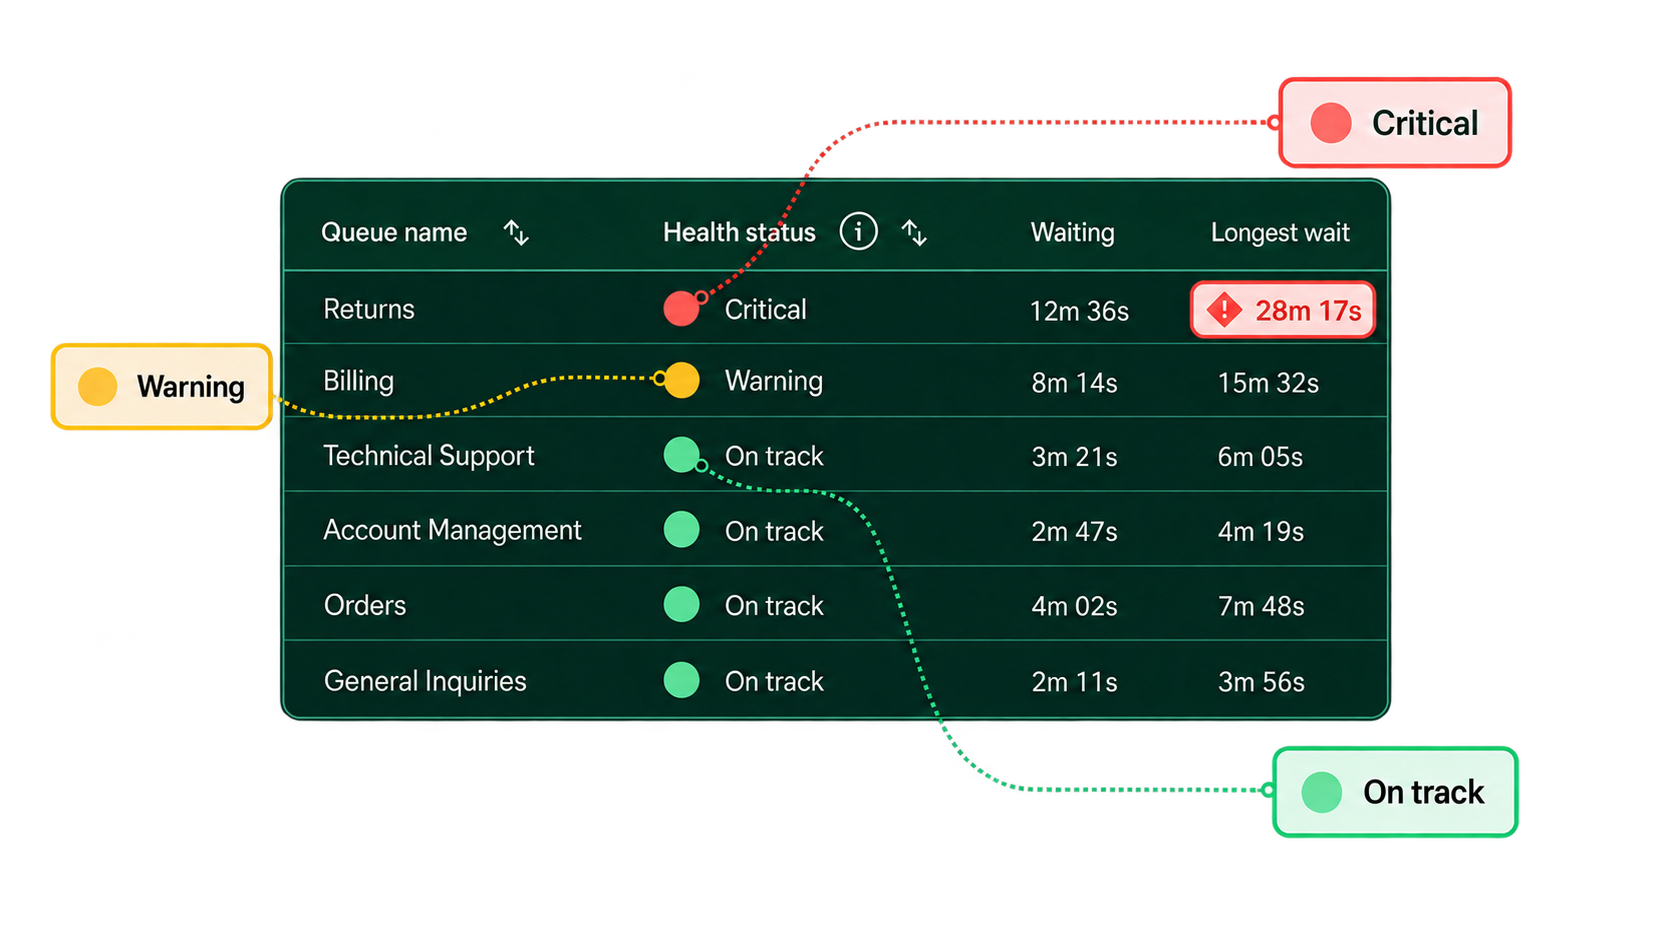
04
Rollups, alerts & notifications
Customer feedback showed that supervisors needed a combined view of their selected queues. Rollup metrics summarised the filtered queues using sums, maximums, and weighted averages appropriate to each metric.
Notifications extended the experience beyond active dashboard monitoring: warning, critical, being handled, and stabilised or resolved.
Alert behaviour
Alerts informed supervisors when a metric, queue, or channel reached a configured threshold. Warning signalled that an issue was developing; Critical indicated that immediate action was required. Each alert identified the relevant metric, channel, and queue. Alert creation and management remained an admin capability.
08
Outcomes
A shift from constant checking to targeted action.
Historical reporting decreased through clearer monitoring, health states, notifications and structured queue context. Supervisors could focus attention where the signals indicated an issue.
Qualitative gains included less time spent preparing reports, lower cognitive load, and better visibility into whether an issue was active, being handled or resolved.
09
Scalability
A system designed to grow beyond one dashboard.
The structure allowed new metrics and integrations to be added without redesigning the whole experience. Configurable cards and tables supported different operational contexts, while reusable thresholds, health states, rollups, and notification patterns created a foundation for future capabilities.
Problems were mapped but not addressed in the delivered scope: delegated administration for external support providers, customer experience professional reassignment recommendations, and expanded predictive capabilities.
10
Takeaway
Supervisors did not simply need more data. They needed data working for them.
The experience shifted the platform from a passive place to look for information into an active operational support system. Instead of making supervisors search for signals across tools and reports, it brought relevant awareness to them, with context that helped them decide what to do next.
Receiving a signal → becoming aware of outliers → understanding context → taking action